GID-Cement
About GID-Cement Emission Database >
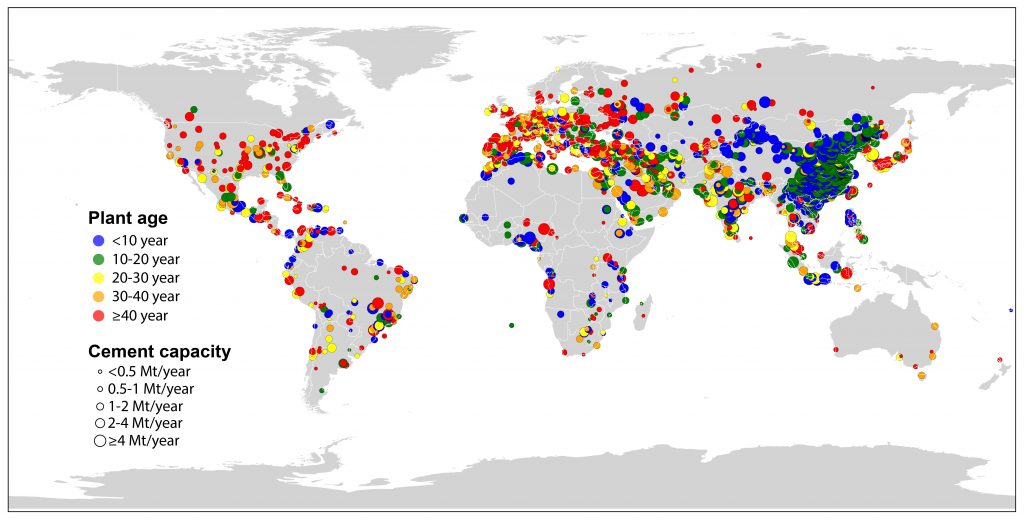
The GID-Cement Emission Database (GCED) provides CO2 and air pollutant emissions as well as underlying information of global cement plants. GCED is based on the integration of global and regional cement plant database such as the Global Cement Directory (Global Cement, 2020) and the IndustryAbout database (IndustryAbout, 2019). We compiled, combined, and harmonized the available data related to cement production kilns from database described above, and filled data gaps with modelled emissions.
The GCED provides up-to-date elementary information and high-resolution emissions from global cement plants, which includes plant-level, national, and regional capacity and age information, as well as anthropogenic emissions of CO2 and various air pollutants (SO2, NOx, primary PM, VOCs, CO, black carbon, and organic carbon). For elementary information which is obtained from collaborators’ database and restricted by user’s license (e.g., Global Cement), we provide cross-links to the original database. Users can purchase the relevant database and merge with GCED to get complete information at plant level.
Construction of the GID-Cement Emission Database >
The GCED is developed by using multisource data fusion technologies, which is firstly obtained from the Global Cement Directory database to compile facility-level information of operating and retired clinker production lines for the historical time series, providing information on the physical address, kiln type, kiln capacity, start year of operation, and retirement year of global clinker kilns. Next, another database, the Industry About database is integrated to fill the missing facility-level information by mapping with the Global Cement Directory databases. Further, the GCED combines and harmonizes the more comprehensive and reliable data provided by official company websites. As for the geographical locations (exact latitudes and longitudes) of cement plants, they are obtained from the Industry About database where available. For the rest of plants with missing geolocations, latitudes and longitudes are got by using Google Maps to map the physical address provided in the Global Cement Directory. The GCED will be updated and improved as more and better data become available.
Estimates of facility-level emissions >
Facility-level information related to the estimates of CO2 and air pollutant emissions from above-mentioned datasets is integrated. In GCED, the estimates of emissions depend on modeled facility-level activity rates and emission factors. Facility-level activity rates are estimated by a function of kiln capacity and capacity factor, with the constraint of country-level fuel consumption from the International Energy Agency (IEA), cement production from USGS, and country-specific clinker-to-cement ratios from various sources. The CO2 emission factors are obtained from IEA, IPCC Guidelines, and previous literatures.
The GID team will timely update air pollutants and carbon dioxide emission inventory and continuously provide high-quality data products by integrating more high-resolution local datasets. If you are looking for more detailed emissions and potential collaboration, please contact us.
If you have any questions, please contact gid@tsinghua.edu.cn.
Related references
Global Cement, Global Cement Directory, 2020, available from https://www.globalcement.com/directory.
IndustryAbout, IndustryAbout database, 2019, available from https://www.industryabout.com/world-cement-industry-map.
International Energy Agency (IEA), World Energy Statistics and Balances 2020, available from https://www.iea.org/data-and-statistics/data-product/world-energy-balances
United States Geological Survey (USGS), Cement Statistics and Information 2020, available from. https://www.usgs.gov/centers/national-minerals-information-center/cement-statistics-and-information
Development History >
The development of GID-Cement Emission Database started in 2020 and we will keep tracking and updating infrastructure changes and related emissions periodically
- In February 2021, GCED v1.0 product is published by the GID team. This online dataset provides basic information of global cement infrastructure and related CO2 emissions in 2019 with different aggregated levels (global summary data for number of plants, total capacity and CO2 emissions, region-level and country-level data for capacity, age and CO2 emissions, and plant-level data). Emissions of air pollutants and emissions for other years will be available once they are finished.
Readme >
- All GID-GCED products are restricted to non-commercial purposes. Any uses of GID-GCED products by business organizations are regarded as commercial purposes which need prior authorization.
- Any papers, reports or products using the GID-GCED data should cite the related publications and websites of GID completely, please see HOW TO CITE.
How to cite >
Using GCED product should cite GID website (http://gidmodel.org.cn/) and the following paper:
Chen, C., R. Xu, D. Tong, X. Qin, J. Cheng, J. Liu, B. Zheng, L. Yan, and Q. Zhang (2022). A striking growth of CO2 emissions from the global cement industry driven by new facilities in emerging countries. Environ. Res. Lett., 17(4), p.044007.
Liu, J., D. Tong, Y. Zheng, J. Cheng, X. Qin, Q. Shi, L. Yan, Y. Lei and Q. Zhang (2021), Carbon and air pollutant emissions from China’s cement industry 1990–2015: trends, evolution of technologies and drivers, Atmos. Chem. Phys., 21, 1627–1647.